The Debugger
From CometWiki
Contents |
Using the Comet IB Debugger
The Debugger is an interactive tool for helping IB programmers debug their applications. It allows you to:
- Step through your program one instruction at a time
- Set “breakpoints” to halt your program at specific instructions
- Select from a list of other conditions which will halt your program
- View and modify the contents of the program variables
- Track the GOSUB and ENTER stacks
While the Debugger is very useful for any IB program, it is particularly valuable when debugging applications that run in background and embedded dialog programs. In these instances, you don’t have a Comet window available to which you can write your own debug messages.
The executable
The Debugger is included as part of the Comet Workstation Install. It is called CosD.exe and resides in your Comet folder. You will find it handy to create a desktop shortcut to it.
Preparing your source
To use the Debugger, you’ll need to compile your program with the “Debug” option. This tells the compiler to produce a supplementary output file with the names of variables, include files, and source line numbers containing executable code. This file will be created in the same folder as your object and will have the same name as the object with an added “.dbg” extension. Here’s an example of the compilation command line used by UltraEdit:
Command line
! //IB// Obj(DbgDemo,Cos) Opt("D") The “D” option triggers the .dbg file for Debugger
Source File
The Debugger only supports text file source programs. Source programs in CED-format are not supported. All include /use files should also be text files. The Debugger will tolerate use files in CED format when these USE files contain ONLY files definitions; USE files that contain executable code MUST be in text format and SHOULD have a .INC file extension.
Source changes
The Debugger "attaches" to a source file. That source file has to be loaded in memory before the Debugger is invoked. If the program being tested begins with an input statement and stops waiting for an operator response starting the Debugger presents no issues. However, there are situations where the program being tested does not stop. In such cases you will have to change the source and code a print and input statement. You can do this in one of two ways You can code
Print "start debugger" & wait
Or you can use the compiler option and code
Set testing=1


   .IF testing
        Print "start debugger"
        wait
   .ENDIF
In either case, you have to change the source file before it can be used in production mode. If you code the Print & wait you have find it and either remove it or comment it out. When you use the Compile Option form, you can put the SET statement early in the source making it easier to find and disable.
Starting the Debugger
To start the Debugger you’ll need to run CosD.exe, then attach it to your IB program. The Debugger uses Windows messaging to talk to your program. Note: Since you need access to the system’s console to run an .exe, the Debugger is not available if you are a Comet Anywhere client.
Don’t be overwhelmed by the number of windows displayed. The Debugger is a very powerful tool and can display many different types of information about the flow of your program. However, you can change the display to show only the windows you need. Many programs can be debugged using only a couple of these windows.
The quickest way to attach the Debugger to your program is to click on “Debug Partition” in the toolbar: It’s the first tool on the left. When the attach dialog pops up, enter the number of the partition where you will run your program.
The Display Windows
Source Window
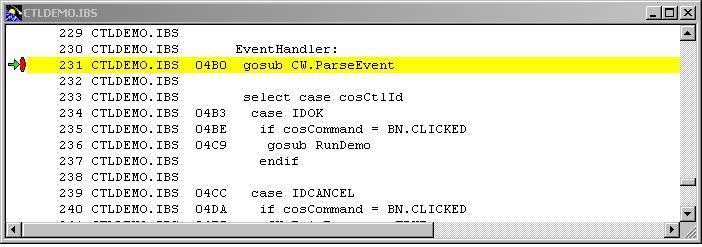
The Source Window is certainly one you’ll find useful. It is here that you will follow the flow of your program. You may also use this window at any time to view any source files “included” in your program. Here’s an example of how your source can be displayed:
The display looks very much like the compiler-produced listing file showing the source line number, source filename, offset in the object file, and IB code. The left margin is used for some special debugger symbols. The green arrow is the instruction pointer. This indicates which line the program is currently stopped at. It will move through the source as you progress through the program. The red oval indicates a breakpoint. This is a marker you can set on any executable instruction to get the Debugger to halt the program just before the instruction is executed. Once halted, you can have a look around at the contents of your variables or begin stepping one instruction at a time.
This display can be customized. You can selectively exclude any or all of the line number, the source filename, or the offset. If any of them are not essential to your debugging, eliminating them from the display will allow you to see more of the IB instruction without having to use the horizontal scroll. To make changes to your preferences, select “View” from the Debugger’s menu and check or uncheck “Line Numbers”, “Filename”, or “Offset” to suit your needs. The Debugger will remember your preferences so that the next time you run it to debug this program, your display will be as you requested. Your program-specific preferences are stored in a file with the same name as the object file with a “.sts” extension.
Watch Variables Window
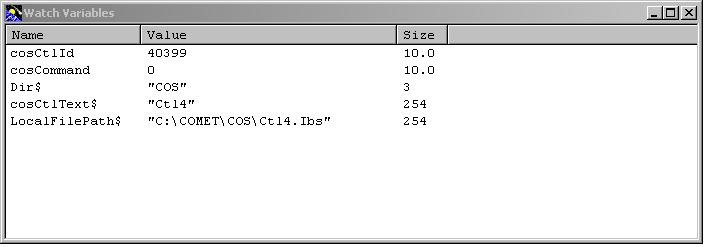
The Watch Variables Window is also extremely useful. It is here that you can view and edit the contents of variables used by your program.
To change the contents of a variable simply double click on its name in the Watch Window. A dialog will popup and prompt you for the new value. String variables that contain hex values can also be viewed and edited. To change the display to hex, right click on the variable’s name and select “View As Hex”. To switch back, select “View As String”.
Note: The contents of variables not in the watch list may be changed by right-clicking on the variable’s name in an IB statement and selecting “Change Value” from the popup menu.
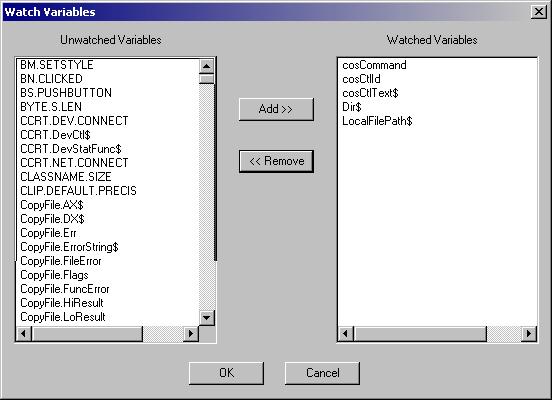
Variables can be added to the watch window in a couple of different ways. The easiest way to add several variables at once is to select “Watch Variables” from the “Debug” menu (Ctrl+W).
Double click on the name of any variable to move it to/from the watch list.
You may also add individual variables as you are stepping through your program by right-clicking on the variable’s name in your IB statement. If you select “Add to Watch” it will be added to the list. If you select “Quick Watch” a popup dialog will show you its current value but it will not be added to the watch list.
Note: Array variables may not be added to the watch list.
The variables selected for the watch list will be remembered in your preferences file (the .sts file).
Call Stack Window
The Call Stack Window can be useful if your program contains multiple GOSUB or ENTER levels. Any time a GOSUB is executed it is added to the window. When a RETURN is executed it is deleted from the window. POP and POPALL will also update the window to reflect the current state of the GOSUB stack. ENTER and EXIT activity is also recorded here.
Windows Messages
The Window Messages Window is only used if you’re debugging a Windows program and even then, only really if you’re debugging the Windows API. Therefore, for most debugging sessions this window can be eliminated.
However, if you’re having a problem with one of the Windows calls, this is one way to view the contents of the API variables being used.
The values displayed represent the following API variables:
- Func: cosOD.Function$
- Cmd: cosOD.Cmd$
- Flags: cosOD.Flags$
- nID: cosOD.nID$
- Msg: cosOD.Msg$
- wParam: cosOD.wParam$
- hDlg: cosOD.hDlg$
As an alternative to the Window Messages Window, you could just add the listed variables to your watch list. But, if you find this method easier and you really need to debug down to this level, here’s how you can invoke this display.
Add the following SET statements to the top of your Windows program:
SET NEW.TRACE = 1 ! This directs the trace messages to the Debugger

SET TRACE.CALLS = 1
Since tracing the Windows calls can generate a lot of messages, you’ll probably want to have it active only around the specific API call that you’re debugging. You can turn it on and off by setting cosTrace to either true or false. cosTrace is initialized to false in CW.Open so be sure to turn it on sometime after your call to CW.Open.
Debug Messages
The Debug Messages Window is used to display progress messages and internal error messages for the Debugger itself. You’ll see lots of activity there when a program is initially being loaded. The name of each source file used by the program will be displayed there as its code is loaded. If any errors occur, they will be displayed there. When a break occurs, the program offset and an internal representation of the instruction causing the break are displayed. This may or may not be very meaningful to the IB programmer. Much of the information in this window is only required if you are experiencing difficulty with the Debugger. Therefore, you may wish to turn off its display until needed and use the screen space for your other windows.
OK, so now that you know how to decide which of the 5 display windows will be useful to you, how do you hide the ones you don’t need? There are several ways.
- Certainly the most straightforward way is to simply close the ones you don’t want.
- You can also resize the ones you do want to cover the others.
- You can also toggle them off and on by selecting the name of the window from the Debugger’s “View” menu.
The Debugger will remember your selections so that the next time you run it your display will be as you requested. These preferences are stored in a file called CosD.ini in your default Windows folder.
Breakpoints
Breakpoints cause the Debugger to suspend the program’s execution until you manually restart it. While the program is suspended, you can examine/modify the contents of the variables and/or check the Call Stack to see how you got to this point in the program. The Debugger supports two types of breakpoints.
- You can choose to halt your program on any particular line of code.
- You can also choose to halt your program when certain types of runtime events occur.
When a breakpoint is set on a line of code, the Debugger will halt the program just before that line of code is executed. A quick way to set this type of breakpoint is to scroll to the line and double-click on it. When a breakpoint is associated with a line of code an oval will appear in the left margin next to the code. To remove the breakpoint, double-click again. A maximum of 20 breakpoints may be set at any one time.
A source line breakpoint is really a three-state object. In addition to being either “set” or “unset” it may also be “disabled”. In this state, a breakpoint remains associated with the source line, but the program will not stop. The oval in the left margin indicates the state of the breakpoint. When a breakpoint is set (i.e. enabled) the oval will be filled with red. When disabled, the oval is empty. This can be useful if you want to stop the program the first time it gets to a line of code but not every time. By disabling it rather than removing it, it’s easy to reinstate it if you restart your debugging session. You can disable a breakpoint by right-clicking on the source line and selecting “Disable Breakpoint” from the popup menu. Breakpoints selected will be remembered in your preferences file (the .sts file).
Note: If there is more than one IB statement on a line, you may only set a breakpoint on the first statement that line.
GOSUB Func1 & GOSUB Func2
In this example you can not set a breakpoint on “GOSUB Func2”.
The second type of breakpoint involves halting your program when certain runtime events occur. You can choose from the following events:
- At the beginning of any program (either RUN or ENTER)
- When returning from an ENTERed program
- At any I/O statement
- At any RTDOS call
- When any handled exception occurs
- When any unhandled exception occurs
By default, the Debugger will stop at the beginning of any program. Breakpoint events are selected by choosing “Options” from the Debugger’s “Edit” menu. These global preferences are remembered in the CosD.ini file.
There are two other ways to get the Debugger to stop your program. The first is a “one time” breakpoint. To set a “one time” breakpoint, scroll to the line of code and highlight it by clicking on it, then right-click and select “Run to selection”. This will cause the Debugger to run your program until it reaches that line of code. Then it will stop. This type of breakpoint is not remembered. The next time your program reaches this line of code it will not stop.
The second way to get the Debugger to stop so you may take control of your program can be used in programs that are either waiting for input at an Input statement or waiting for an event at an EventWait statement. To get the program to break, right-click anywhere in the source window and select “Break” from the popup menu. As soon as the Input or EventWait is satisfied it will stop at the subsequent instruction.
Once a break occurs, the Debugger gives you control over the execution of your program. You can set other breakpoints to jump ahead to a new location or you can step through the code one line at a time. When your program is stopped at a line with a GOSUB you have the choice of either stepping across the GOSUB or stepping into the subroutine. You can use these Function Keys to control the execution:
- F5 run until the next breakpoint
- F10 step to the instruction on the next line (will go over a GOSUB)
- F11 step into a GOSUB subroutine
- Shift+F11 run out of a subroutine stopping on the line just past the GOSUB
Other Useful Features
You are not limited to viewing just the code near the instruction pointer. From the Debugger’s “Window” menu, you can select any of the files included with your program. It will be displayed in the Source Window. To return the display to the file and line where the instruction pointer is, select “Goto IP” from the “Debug” menu (Alt+F5).
In addition to manually sizing and locating each of the display windows, you can have the Debugger automatically either tile or cascade them for you. Select your choice from the “Window” menu.
A quick way to edit your list of source line breakpoints is through the Breakpoints popup dialog. Select “Edit Breakpoints…” (Ctrl+B) from either the “Edit” or “View” menu. Breakpoints will be listed with the source file name and line number. A check box indicates whether the breakpoint is currently enabled or not. You may enable/disable or remove any breakpoint, or remove them all with a single click.
To detach the Debugger from your program, click on “Stop Debugging” in the toolbar: the second tool on the left.
These notes were prepared by Barbara Brazil for the 2005 Signature Systems, Inc Users Group Meeting.


