More Debugger
From CometWiki
Contents |
Comet Debugger
Overview
The Comet Debugger is a powerful tool for debugging your Internet Basic programs. With the debugger, you can:
- Watch your program execute one instruction at a time
- Display the source code for the program that is running
- Highlight the source code line for the instruction that is being executed
- Examine the value of any of your program variables while the program is running
- Examine the value of any system variable while the program is running
- Dynamically set up to 20 breakpoints in your code where the debugger will temporarily stop program execution
- Resume program execution, either one instruction at a time or until the next breakpoint
- Look at the contents of the subroutine stack
- Display window messages
- Debug a program running in any partition on your system, including background partitions (including XAP programs)
- Choose to step through or skip over subroutines
The Comet Debugger is available to those programmers using the Internet Basic Development Platform. The minimum Comet requirement is Comet2003 Build 321.
Getting Ready to Debug
In order to use the Comet Debugger, your source program and include files must be text files (i.e., UltraEdit files). To prepare for debugging your program, you must compile the program with the "D" option, as shown here:
!//IB// Src(test.ibs,dsk) Obj(test,dsk) Opt(D)
Using the "D" option causes the compiler to create a debug file that has the same filename as the object program, but with a ".DBG" extension. In the above example, the debug file would be named TEST.DBG and would be located in the DSK directory. (Note: The debug file is not contained in the QDIR.)
The debug file is required for debugging. When you are done debugging, we recommend that you delete the .DBG file.
Starting the Debugger
Before starting the debugger, make sure that Comet is running. The Comet Debugger is included with the Comet release. The program name is:
COSD.EXE
Create a desktop shortcut to this program. When you run the debugger, the following screen is displayed:
 Notice the five windows contained in the display:
Debug Messages -- where status messages are displayed
Source -- where the source code is displayed
Watch Variables -- where selected variables are displayed
Call Stack -- where subroutine labels are displayed
Window Messages -- where Window messages are displayed
The debugger works by latching onto a program as it is running. You have the option of attaching to a partition number, session number, or terminal number. These options are contained on the "Comet" menu.
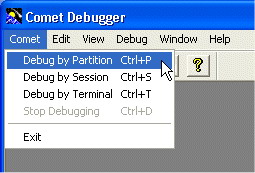

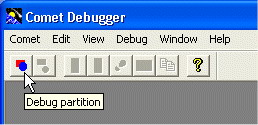
Alternatively, click the "Debug partition" icon on the tool bar.

Attach to the partition/session/terminal before running the program you want to debug.
When you are finished debugging your program, choose the "Stop Debugging" option. This detaches the debugger from your program.

Alternatively, click the "Stop debugging" icon on the tool bar.

Debugger Options
The debugger works by stopping your program when certain instructions are executed. You can choose the exact location where your program will stop by setting breakpoints (see below), or you can have the system stop when certain types of instructions occur.
To specify which type of instructions will automatically stop program execution, choose "Options..." from the "Edit" menu.

The following options are available:

- To cause the debugger to stop whenever your program encounters a RUN or ENTER instruction, check the "Begin Program (Run/Enter)" box
- To stop whenever your program encounters an EXIT instruction, check the "Return from Program (Exit)" box
- To stop whenever your program encounters an I/O statement, check the "I/O Statements" box. Note that you program will always stop when it encounters an INPUT or WAIT statement.
- To stop whenever your program encounters a Runtime DOS instruction, check the "RTDOS Calls" box
- To stop whenever your program encounters a handled exception (via EXCP=), check the "Handled Exceptions" box
- To stop whenever your program encounters an unhandled exception, check the "Unhandled Exceptions" box
Source Code Display
When you debug a program, the source code is displayed in the "Source" window. Notice the green arrow to the left of the current line. This arrow is the "instruction pointer" which indicates the location of the current instruction where the program is stopped.
 The source code display includes the source line number, the name of the source program, the object code address (also known as the "offset"), and the source line itself. The line numbers, program name, and offsets are optional and may be turned on/off via the "View" menu.

Watched Variables
The debugger provides a way for you to watch the values of your program variables, system variables, and symbolic constants. There are two ways to choose which variables will be watched. The first way is to select "Watch Variables" from the "Debug" menu (or use the Ctrl+W keyboard accelerator).

The following dialog is displayed. To choose a variable to watch, select the variable from the list of unwatched variables on the left and click the "Add" button. To remove a variable from the watch list, select the variable from the list of watched variables on the right and click the "Remove" button.

The selected variables appear in the "Watch Variables" window. The current value of each variable is displayed, along with the length/precision of each variable. As you step through your code, these values are updated.

Quick Watch
The second way to watch variables is to use the "Quick Watch" feature. The following methods activate the feature:
- Selecting the "Quick Watch" option on the "Debug" menu
- Using the Shift+F9 keyboard accelerator
- Right clicking on a variable name in the "Source" window
The following dialog is displayed:
File:Debug10.jpg
The dialog shows the selected variable along with its current value, type, length, and precision.
- To display the value in hex, check the "Display as Hex" box
- To recalculate the value, click the "Recalculate" button
- To add this variable to the watch list, click the "Add to Watch" button
Stepping Through Your Program
To step through your program one instruction at a time, use one of the following methods:
- Select the "Step Into" option from the "Debug" menu
- Press the F8 or F11 key
- Click the "Step Program" icon on the tool bar

Stepping Into or Over a Subroutine
When you encounter a GOSUB statement, you can choose to step into the subroutine (to step through the subroutine one line at a time) or step over the subroutine (to avoid stepping through the subroutine one line at a time). If you step over the subroutine, the subroutine code will be executed and the debugger will stop at the instruction following the GOSUB statement.
To step into a subroutine, use one of the following methods:
- Select the "Step Into" option from the "Debug" menu
- Press the F8 or F11 key
- Click the "Step Program" icon on the tool bar
To step over a subroutine, use one of the following methods:
- Select the "Step Over" option from the "Debug" menu
- Press the F10 key
If the debugger is in a subroutine and you want to stop debugging the subroutine (but continue debugging the rest of the program), use one of the following methods to "step out" of the subroutine:
- Select the "Step Out" option from the "Debug" menu
- Press Shift+F11
- Click the "Step out of function" icon on the tool bar

Setting Breakpoints
As an alternative to stepping through your program one instruction at a time, you can set breakpoints where the debugger will stop program execution. You can set up to 20 breakpoints. To set a breakpoint, use one of the following methods:
- Highlight the source line and press the F9 key
- Double click the source line where you want to insert a breakpoint
The breakpoint is shown as a red oval on the left of the source line.

To start the program executing, use one of the following methods:
- Select the "Go" option on the "Debug" menu
- Press the F5 key
- Click the "Run without tracing" icon on the tool bar

The debugger will then stop the program at the first breakpoint it encounters. (The debugger also stops at any of the instructions you've chosen in the "Options" setting, including Run/Enter, Exit, I/O statements, RTDOS calls, handled exceptions, and unhandled exceptions. Also note that the program stops on its own accord at INPUT and WAIT statements.)
To force the program to stop at any other time, click on the "Stop program" icon on the tool bar.

The window caption line indicates whether the program is running or stopped.


- Program is running
- Program is stopped
Editing Breakpoints
There are several ways to edit breakpoints. To remove a breakpoint, highlight the line containing a breakpoint and use one of the following methods:
- Select the "Remove Breakpoint" option on the "Debug" menu
- Press the F9 key
- Press Alt+F9
- Double click the source line
To remove all breakpoints, use one of the following methods:
- Select the "Clear Breakpoints" option on the "Debug" menu
- Press Ctrl+P
You can also disable a breakpoint, which leaves a breakpoint marker in place but does not enable the breakpoint for that instruction. To disable a breakpoint, use one of the following methods:
- Select the "Disable Breakpoint" option on the "Debug" menu
- Press Ctrl+F9
The disabled breakpoint appears as follows:

To edit the entire list of breakpoints, use one of the following methods:
- Select the "Edit Breakpoints" option on the "Debug" menu
- Press Ctrl+B
The following dialog is displayed:

This dialog shows all of the breakpoints and indicates, via a checkbox, whether the each breakpoint is enabled or disabled. To disable a breakpoint, uncheck the appropriate box. To enable a breakpoint, check the appropriate box.
This dialog also contains buttons that remove a breakpoint or remove all breakpoints.
Run to Selection
If you want your program to run up to a certain instruction, but you don't want to set a breakpoint, you can use the "run to selection" option. In effect, this feature works as a "quick breakpoint." To use this feature, highlight the source line where you want to stop executing, and then use one of the following methods:
- Select the "Run to Selection" option on the "Debug" menu
- Press Ctrl+F10
Break
The "Break" option causes the debugger to stop a currently executing program. This option is typically used when the program is stopped at an INPUT statement. Issuing a break at that point stops program execution after the INPUT is completed.
To issue a break, use one of the following methods:
- Select "Break" on the "Debug" menu
- Press Shift+F5
Go to IP
While looking at the source code in the "Source" window, you can instruct the debugger to display the source line where the instruction pointer (IP) is located. To use this feature, use one of the following methods:
- Select "Goto IP" on the "Debug" menu
- Press Alt+F5
Call Stack
The Call Stack window displays the subroutine stack. This list is displayed in inverted order, with the most recent subroutine call shown at the top of the list.
The following example shows the program name that is running ("TEST" on "BAM") and shows that the program is currently nested two subroutines deep ("ROUTINE1" followed by "ROUTINE2")

Include Files
If your program contains include files (i.e., usefiles), you can view any of them by choosing the file name on the "Window" menu. The contents of the include file are displayed in the source code window.

If your program executes instructions in an executable include file, that file is automatically displayed in the source code window as you step through the code.
Note that the debugger requires all source and include files to be text files.
Window Messages
The "Window Messages" window show messages generated by the Windows Development Library (WDL). This feature must be enabled in your code by setting the following symbolic constants:
SET NEW.TRACE = 1       ! Enable tracing
SET TRACE.CALLS = 1     ! Show outgoing messages
SET TRACE.RECEIVE = 1   ! Show incoming messages
Also, in order for the Windows message trace feature to work, you must first enable the cosTrace variable. This is a feature that allows the user to control when the messages are displayed.
cosTrace = TRUE ! Enable trace messages
The following sample display comes from the DIRECT.IBS,DLG program.
